Upload date
All time
Last hour
Today
This week
This month
This year
Type
All
Video
Channel
Playlist
Movie
Duration
Short (< 4 minutes)
Medium (4-20 minutes)
Long (> 20 minutes)
Sort by
Relevance
Rating
View count
Features
HD
Subtitles/CC
Creative Commons
3D
Live
4K
360°
VR180
HDR
829,215 results
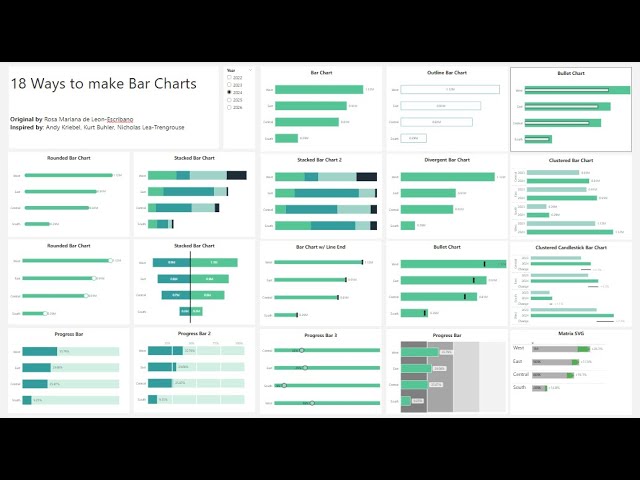
... 01:54 - Level 1: Simple Bar Chart 06:00 - Bar Chart Grouped by Type 08:01 - Line Chart: Tasks Done Per Day 10:38 - Bar Chart: ...
35,800 views
5 months ago
Learn this 1 trick to create a wide variety of new charts natively in Power BI. In this video I show you how to do it. Enjoy and ...
81,412 views
11 months ago
Discover how to maximize your Power BI Bar Charts from scratch in this beginner-friendly tutorial. Learn how to create any type of ...
9,782 views
2 weeks ago
Links ::::::::::::::: PBIX here: https://workout-wednesday.com/pbi-2024-w11/ IBCS style Matrix Tutorial: ...
14,675 views
Have you ever felt the need to keep track of the pages you view on an Onboarding? Here it comes in handy to know how to make ...
3,653 views
In this video, we explain how the Bar Chart works in the fl_chart package. We talk about all the properties that we have in the ...
9,043 views
9 months ago
... and Graphs 00:27 Cartesian Coordinate 01:51 Scatter Plots 03:12 Line Graphs 04:02 Pie or Circle Charts 04:46 Bar Graphs ...
12,867 views
In this video we take a look at introducing beautiful data display charts in #FlutterFlow using the powerful #Syncfusion libraries.
11,493 views
Join us: Telegram- https://t.me/free_online_classes_Mathelogy Instagram- ...
64 views
Streamed 2 days ago
The video solutions to the Corbettmaths Practice Questions on Composite Bar Charts. Practice Questions: ...
464 views
6 months ago
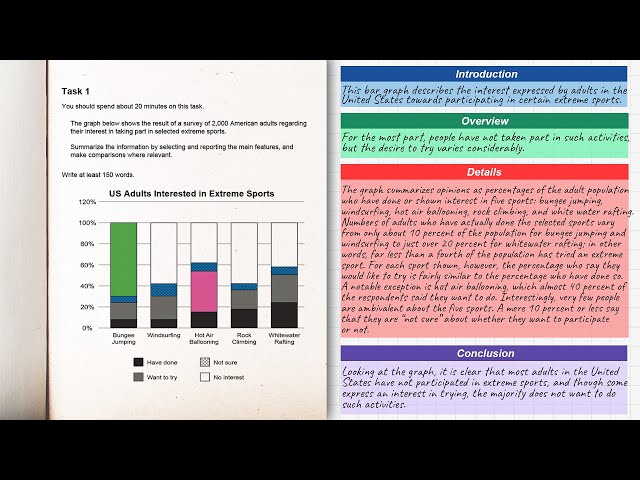
Learn how to write a Band 9 answer for a bar chart graph in IELTS Writing Task 1. Watch this video and get tips and strategies to ...
3,000 views
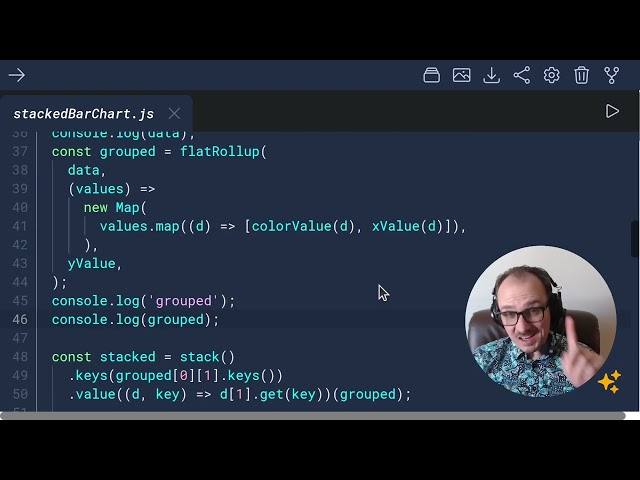
Creating a stacked bar chart with D3.js with an interactive color legend! Covers D3 flatRollup, stack, Map, Array.flat, and lots of ...
880 views
10 months ago
A tutorial on the steps to create a simple bar graph in APA Style (7th Ed) in LibreOffice and Open Office, as well as adding error ...
178 views
Timestamps: 00:00 Intro 01:15 Bar Charts 04:40 Pie Charts 09:52 Comparison 14:18 Progress Charts 20:41 Research Results ...
33,428 views
Welcome to this Grade 8 maths lesson! In this video, we'll dive into Bar graphs, a fundamental part of the Grade 8 Mathematics ...
253 views
8 months ago
Also made a few optimizations to the Bar Graph visual, including the ability to slow down the app's refresh rate to ease ...
10,143 views
... math concepts, will walk you through each type of data interpretation, from bar graphs and pie charts to line graphs and tables.
229,375 views
Streamed 3 months ago
The video solutions to the Corbettmaths Practice Questions on Bar Charts. Practice Questions: ...
1,194 views
Power BI | Advanced Bar Chart | Custom Bar Chart | Power BI Tutorial #powerbi #dataanalysis Data Science Odin School Link ...
5,002 views
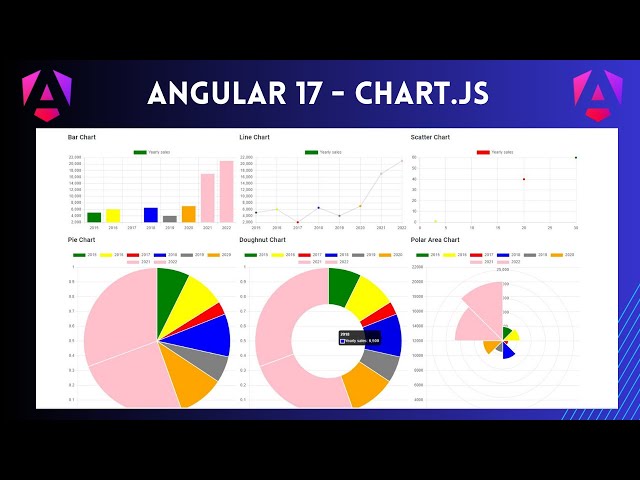
angular17 #chart #nihiratechiees #chartjs This video explains implementing Charts in angular using Chart.js library Charts that ...
11,063 views


![[IBCS] Advanced Power BI Tutorial - Native Bar Chart (With PBIX)](/api/proxy/image?url=https%3A%2F%2Fi.ytimg.com%2Fvi%2F00Q6o0tddd0%2Fsddefault.jpg)